Sales & Marketing Dashboard
Look for KPI Trends and Find Opportunities
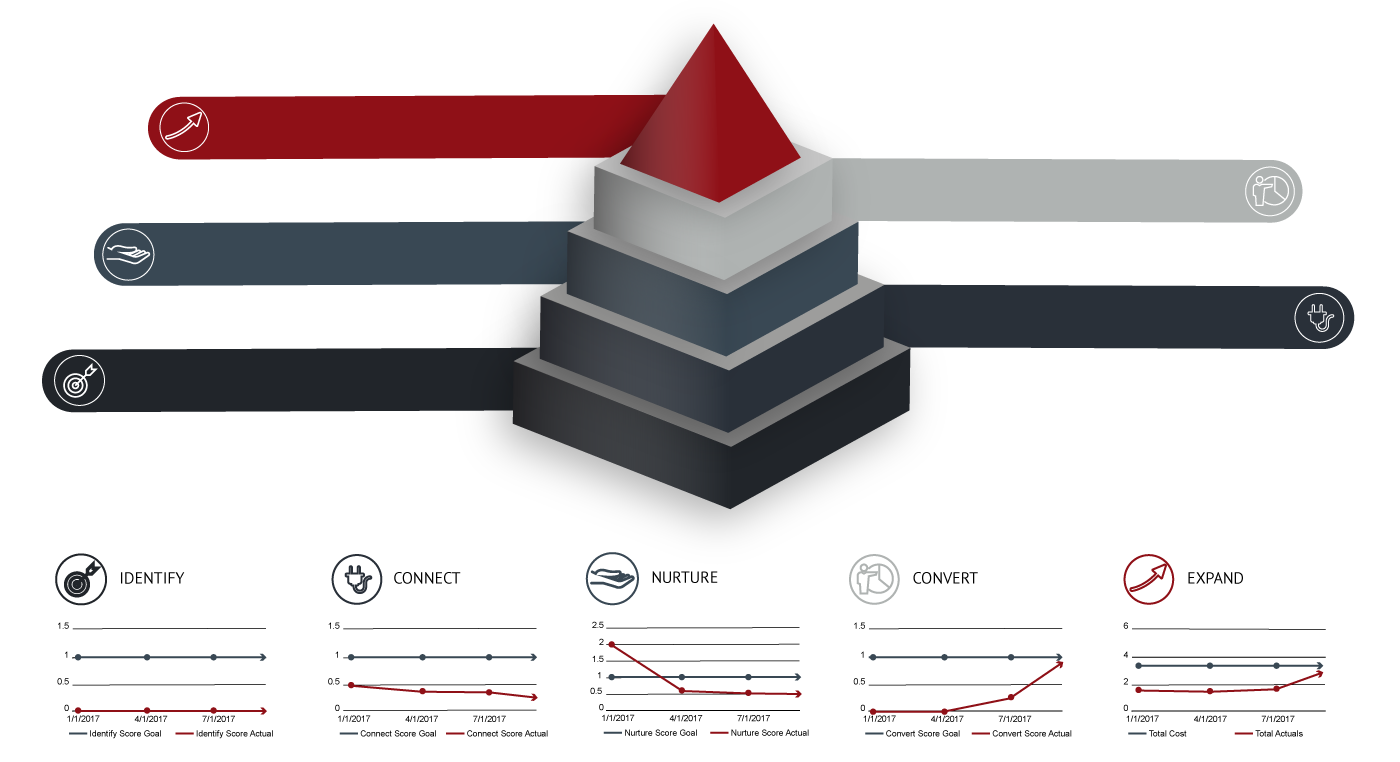
Each company’s specific dashboard structure and data sources will vary a bit. However, we do have a standard starting point. Ultimately we’re looking for a single page display of KPI trends so that we can quickly diagnose problems and zero in on opportunities. Here is an example:

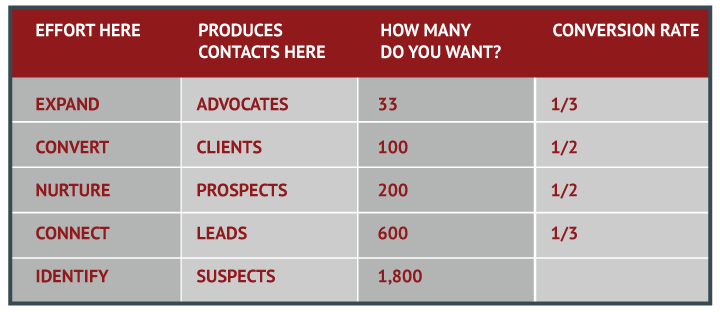
This dashboard is organized by steps of the buyer/seller journey. As the seller, your job is to identify enough traffic, connect with enough leads, keep enough leads engaged, convert those leads into sales and expand those clients into more business. To set the goals for each stage you’ll need to create a baseline of conversion percentages like this:
CONVERSION GOALS

The KPI Dashboard serves as the quick indicator. Behind the dashboard lies the detailed analysis of
things like user flow, channel sources, on-site goal conversions, etc.
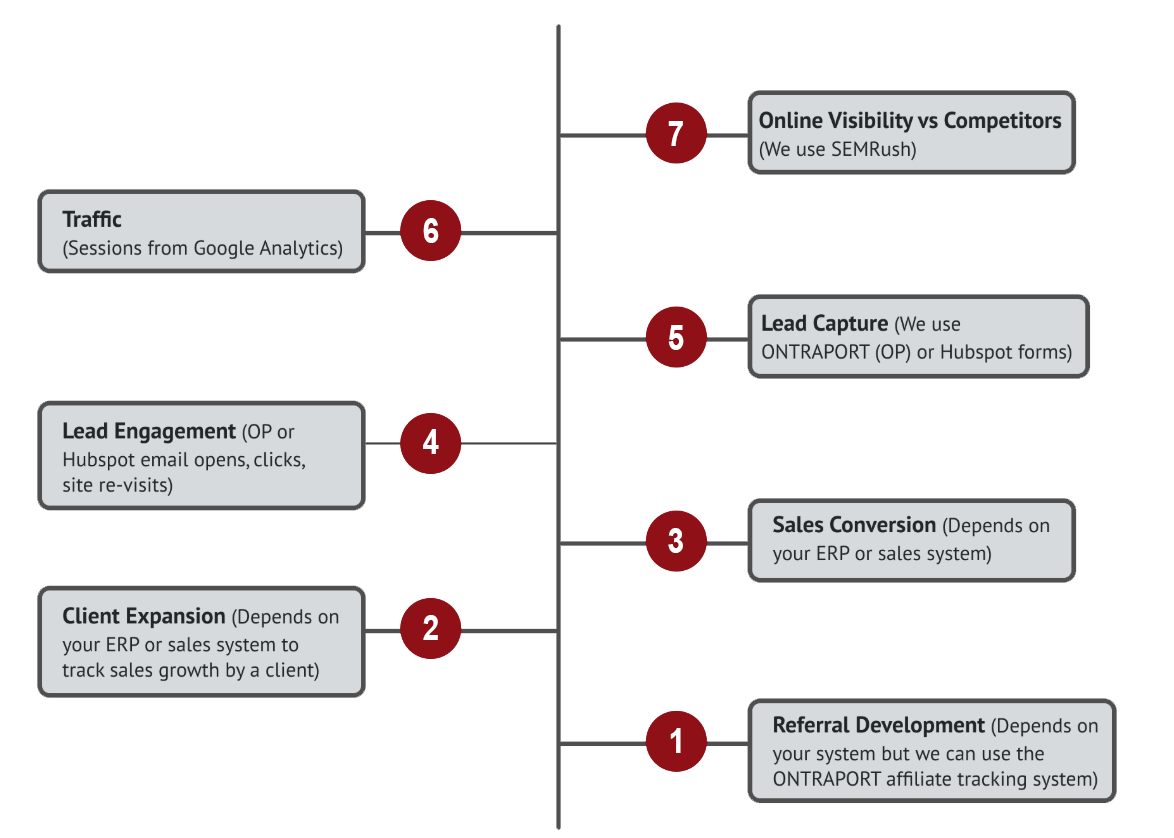
Here is A List Of Our Starting Point KPIs:

Most social media and paid traffic sources will have their own reporting dashboards so we try not to muddy
up these higher level items. Of course, those other sources require in depth planning and management.
Examples Of Web Marketing Programs Where We Use Dashboards To Monitor KPIs.
Other Resources:

DETERMINING YOUR MOST IMPORTANT BUSINESS METRICS
Monitor, produce and report on both reliable and accurate business data.

HOW MARKETING TRACKING WORKS
Know and measure exactly which pieces of your marketing efforts are working.


